Gerardo Gonzalez, the licensed Compass agent behind LuxuryDade, scored 28 Miami-Dade neighborhoods with 30 or more sales on four buyer signals. Norland and Carol City in Miami Gardens, Central Gables and Southwest Coconut Grove lead in 2026. Norland's price per square foot rose 22.8% year over year to $371 across 33 sales in the three months to October 31, 2026, according to the Redfin Data Center, and homes sold in a median 76 days.
Most "best neighborhoods" lists rank by vibe or by price. I wanted a list a buyer could check. So I took every Miami-Dade neighborhood in the Redfin Data Center with at least 30 home sales in the latest rolling three-month window, which left 28, and scored each one on the same four signals. The result is not a list of the most expensive places. It is a list of the places where a home purchase looks healthiest right now: values holding, supply balanced, homes selling in a reasonable time and close to the asking price.
The 10 Best Miami Neighborhoods to Buy a Home in 2026, Ranked
Every figure below comes from the Redfin Data Center neighborhood file: all home types, rolling three months from August 1 to October 31, 2026. The score runs from 0 to 100 and is explained in the next section. Neighborhood names that link go to our own report or guide for that area.
| Rank | Neighborhood | Score | Median sale price | Price per sq ft (YoY) | Median days on market | Months of supply | Sale-to-list | Homes sold |
|---|---|---|---|---|---|---|---|---|
| 1 | Norland (Miami Gardens) | 91 | $499,761 | $371 (+22.8%) | 76 | 5.8 | 96.7% | 33 |
| 2 | Central Gables (Coral Gables) | 83 | $844,596 | $589 (+14.2%) | 73 | 6.9 | 96.0% | 48 |
| 3 | Carol City (Miami Gardens) | 82 | $549,737 | $381 (+5.7%) | 49 | 4.5 | 98.0% | 82 |
| 4 | Southwest Coconut Grove (City of Miami) | 76 | $2,598,757 | $1,051 (+21.7%) | 66 | 5.1 | 94.5% | 34 |
| 5 | West End (Miami-Dade) | 75 | $392,312 | $335 (+4.1%) | 67 | 7.9 | 96.4% | 54 |
| 6 | Model City (City of Miami) | 66 | $484,768 | $349 (+1.4%) | 64 | 5.5 | 93.9% | 50 |
| 7 | Northeast Coconut Grove (City of Miami) | 66 | $2,248,924 | $1,101 (+28.6%) | 108 | 6.4 | 93.7% | 112 |
| 8 | Dadeland (Miami-Dade) | 65 | $369,823 | $371 (+2.0%) | 110 | 6.4 | 95.3% | 53 |
| 9 | Flagami (City of Miami) | 65 | $634,696 | $382 (-6.3%) | 76 | 5.1 | 95.7% | 58 |
| 10 | Key Biscayne | 58 | $1,574,247 | $1,058 (+13.9%) | 103 | 8.6 | 94.7% | 49 |
Two cautions on reading this table. These are blended figures for houses and condos together, so a neighborhood with a few estate sales can post a big jump in median price that is really a change in what sold. That is why I score price per square foot, not median price. And a neighborhood with 33 sales can move a lot from one quarter to the next, so treat the order inside the top ten as direction, not a fixed ladder.
How I Ranked Them
Each of the 28 neighborhoods was ranked against the other 27 on four signals, and each signal is worth up to 25 points:
- Price trend: the year-over-year change in median price per square foot. Rising or steady values score higher.
- Balanced supply: months of supply, scored by how close it sits to 6 months, the line most of the industry uses between a buyer's and a seller's market.
- Speed of sale: median days on market. Faster means an easier resale when you are the seller.
- Sale-to-list ratio: how close homes close to their asking price. Higher means real demand behind the listings.
The advice I keep repeating to buyers who ask me where to buy a home in Miami is that a neighborhood average only tells you where to start looking. My read on this list is the same two-speed story I see across the county: the places at the top are balanced markets where homes trade near the asking price in about two months, while the condo-heavy districts at the bottom are sitting on 13 to 38 months of supply. Both can be good buys. They call for very different offers.
Miami Gardens: Norland and Carol City Lead on Value
Norland tops the ranking. Its median sale price was $499,761 on 33 sales, price per square foot rose 22.8% to $371, supply sat at a balanced 5.8 months and homes closed at 96.7% of list. Carol City, the larger market of the two with 82 sales, posted the fastest median sale time in the whole set at 49 days, a 98.0% sale-to-list ratio and just 4.5 months of supply.
My take for a buyer here: this is a primary-home market, not a trophy market, and that is exactly why it scores well. When homes sell this fast near asking, I tell buyers to come in with financing already approved and an inspection plan ready, because a slow offer usually loses.
Coral Gables and Coconut Grove: Where Values Held at the High End
Central Gables is the second-best market on our score. Its median sale price was $844,596, price per square foot rose 14.2% to $589, and homes took a median 73 days with 6.9 months of supply. That combination of rising values and a balanced market is rare at this price level in Miami right now.
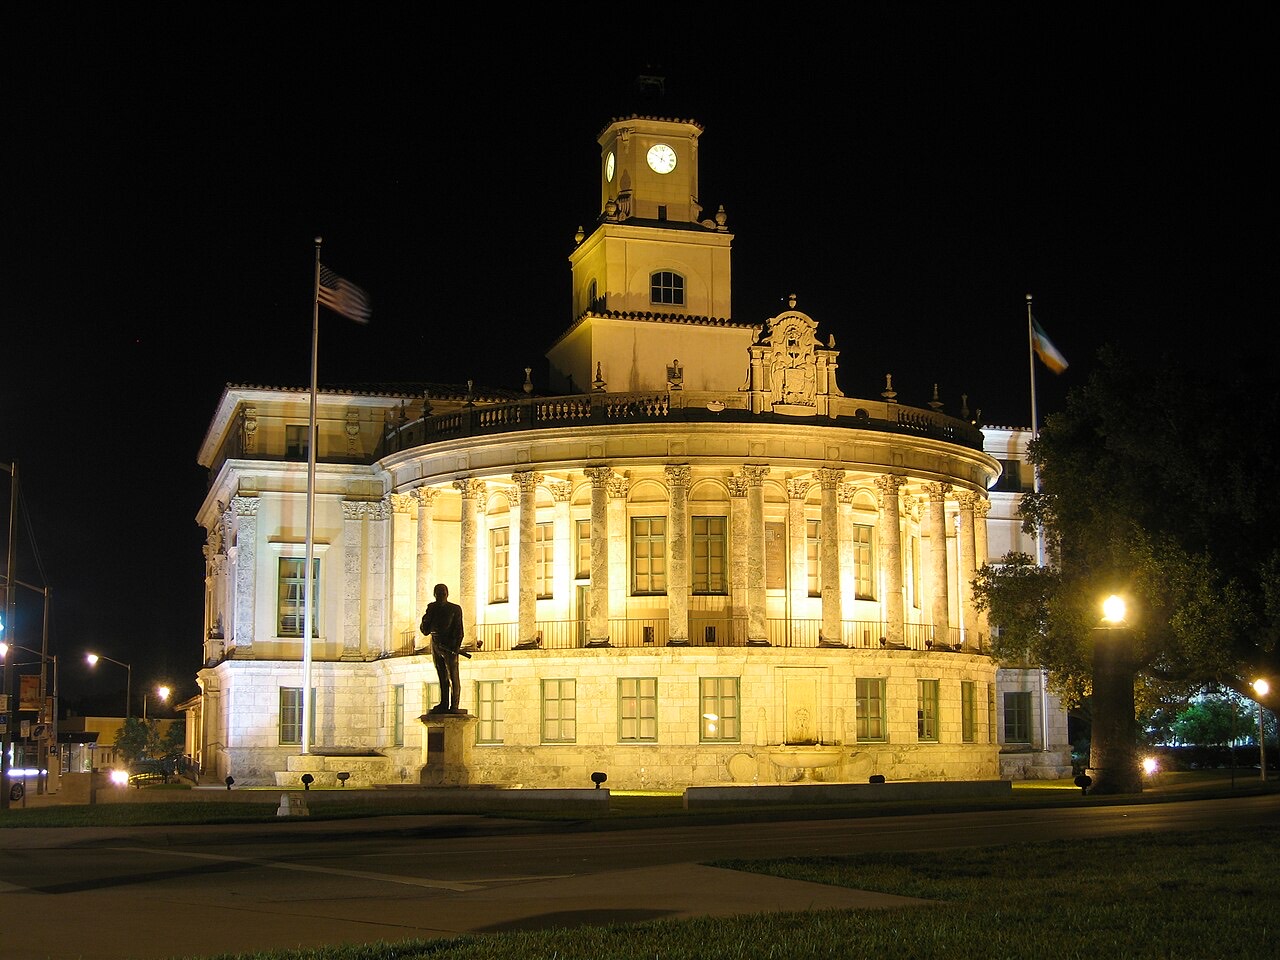
Coconut Grove takes two spots. Southwest Coconut Grove ranks fourth with a median sale price of $2,598,757, price per square foot up 21.7% to $1,051 and a 66-day median sale time. Northeast Coconut Grove, the deeper market with 112 sales, ranks seventh: price per square foot rose 28.6% to $1,101, but homes took a median 108 days and closed at 93.7% of list. In the Grove I tell families to look at the street, the school run and the flood elevation before the finishes, and my guide to family homes in Coconut Grove goes street by street.
West End, Model City, Dadeland, Flagami and Key Biscayne
West End ranks fifth with the lowest median price in the top ten, $392,312, and a 67-day median sale time. Model City, in the City of Miami, ranks sixth at $484,768 with 5.5 months of supply and a 64-day median sale time. Dadeland ranks eighth at $369,823 with 6.4 months of supply, and Flagami ninth at $634,696 with homes selling in a median 76 days, although its price per square foot slipped 6.3%.
Key Biscayne closes the top ten. Its median sale price was $1,574,247, price per square foot rose 13.9% to $1,058, and supply sat at 8.6 months. On the island, the purchase price is only half the decision. I walk every buyer through insurance, the condo association's reserves and any assessments before we write an offer, and my Key Biscayne condo guide covers that building by building.
Where Buyers Have the Most Negotiating Room
The bottom of the ranking is not a list of places to avoid. It is where a buyer holds the cards. Downtown Miami recorded the most sales of any neighborhood, 223, but carried 24.8 months of supply and a 144-day median sale time. Midtown and Wynwood-Edgewater, which Redfin reports with identical figures, had 15.6 months of supply, a 163-day median sale time and price per square foot down 12.5%. The Miami Central Business District sat at 37.8 months. Our Miami months of supply report tracks the same signal across the county.
In those condo districts I write offers below asking and ask for closing credits, because the supply numbers support it. In the top ten, that same approach usually loses the house.
What I Would Check Before Buying in Any of These Neighborhoods
The thing I push hardest on with every buyer is the carrying cost, not the price. Property tax, insurance, HOA dues and any special assessment decide whether a home is a smart hold. For condos, read the association's reserve study and milestone inspection status first, using my SB 4-D special assessment guide. For the full ownership math, see the true cost of owning a Miami condo. And if you want the priciest addresses rather than the best value, my ranking of Miami's most expensive neighborhoods covers that side of the market.
"A good neighborhood to buy in is one where you could sell next year without a fight. Right now, in Miami, that is the balanced markets near the top of this list, not the busiest condo districts."
Gerardo Gonzalez, Licensed Real Estate Agent at Compass