LuxuryDade tracks months of supply across all three South Florida counties, and Miami-Dade condominiums carried 12 months in July 2026 while single-family homes carried 4.8, per MIAMI REALTORS + RWorld. I tell clients the 12 is already stale as a trend, because condo inventory has fallen six straight months. Price the property type, not the county, and check which way its supply is moving first.

Months of supply answers one question: if nothing new came on the market tomorrow, how long would today's listings take to sell at the current pace. The balanced benchmark Florida Realtors publishes is 5.5 months. Below that, sellers set the terms. Above it, buyers do. It is the single cleanest read on negotiating leverage, and it is the number almost every Miami headline skips in favour of the median price.
The reason it matters more here than in most metros is that South Florida does not have one answer. In July 2026 Miami-Dade condominiums were sitting at 12 months and Miami-Dade houses at 4.8, according to MIAMI REALTORS + RWorld. Those two figures describe the same county in the same month, and they point in opposite directions. This report puts every county and property type in one table, shows which way each is moving, and explains what a 12-month market actually costs you in time.
- The Table: Months of Supply Across South Florida, July 2026
- Why One County Runs Two Opposite Markets
- The Part Headlines Miss: Condo Supply Is Falling Fast
- Broward and Palm Beach: Same Split, Different Depth
- What 12 Months of Supply Costs You in Time
- The Financing Squeeze Sitting Underneath the Condo Number
- Why Pre-Construction Is Not in These Numbers
- Gerardo's Read: Using Supply as a Buyer and as a Seller
- How Months of Supply Is Calculated, and Why the Denominator Changes the Answer
- Methodology and Sources
- Frequently Asked Questions
The Table: Months of Supply Across South Florida, July 2026
Six numbers cover the whole region. Three counties, two property types each, all from the July 2026 statistics MIAMI REALTORS + RWorld released on August 17, 2026. The active listing count and the year-over-year inventory change sit beside each figure, because a supply number without its direction is half a fact.
Read the last column first. Every one of these six markets is losing inventory year over year, which is why none of the supply figures below should be treated as a resting level.
| County | Property Type | Months of Supply | Market Condition | Active Listings | Inventory, Year on Year |
|---|---|---|---|---|---|
| Miami-Dade | Existing condominiums | 12.0 | Buyer's market | 11,324 | -11.79% |
| Miami-Dade | Single-family homes | 4.8 | Seller's market | 4,275 | -22.82% |
| Broward | Existing condominiums | 10.0 | Buyer's market | 9,533 | -15.79% |
| Broward | Single-family homes | 4.3 | Seller's market | 4,416 | -24.95% |
| Palm Beach | Existing condominiums | 6.7 | Buyer's market, narrowly | 5,853 | -19.26% |
| Palm Beach | Single-family homes | 3.7 | Seller's market | 4,590 | -23.32% |
| United States | All existing homes | 4.6 | Seller's market | 1,540,000 | -0.6% |
People ask me whether Miami is a buyer's market, and the honest answer is that the question is missing a word. Miami-Dade condos are a buyer's market at 12 months. Miami-Dade houses are a seller's market at 4.8. Same county, same month, and the strategy for each is the opposite of the other.
Gerardo Gonzalez, Licensed Real Estate Agent at Compass
Why One County Runs Two Opposite Markets
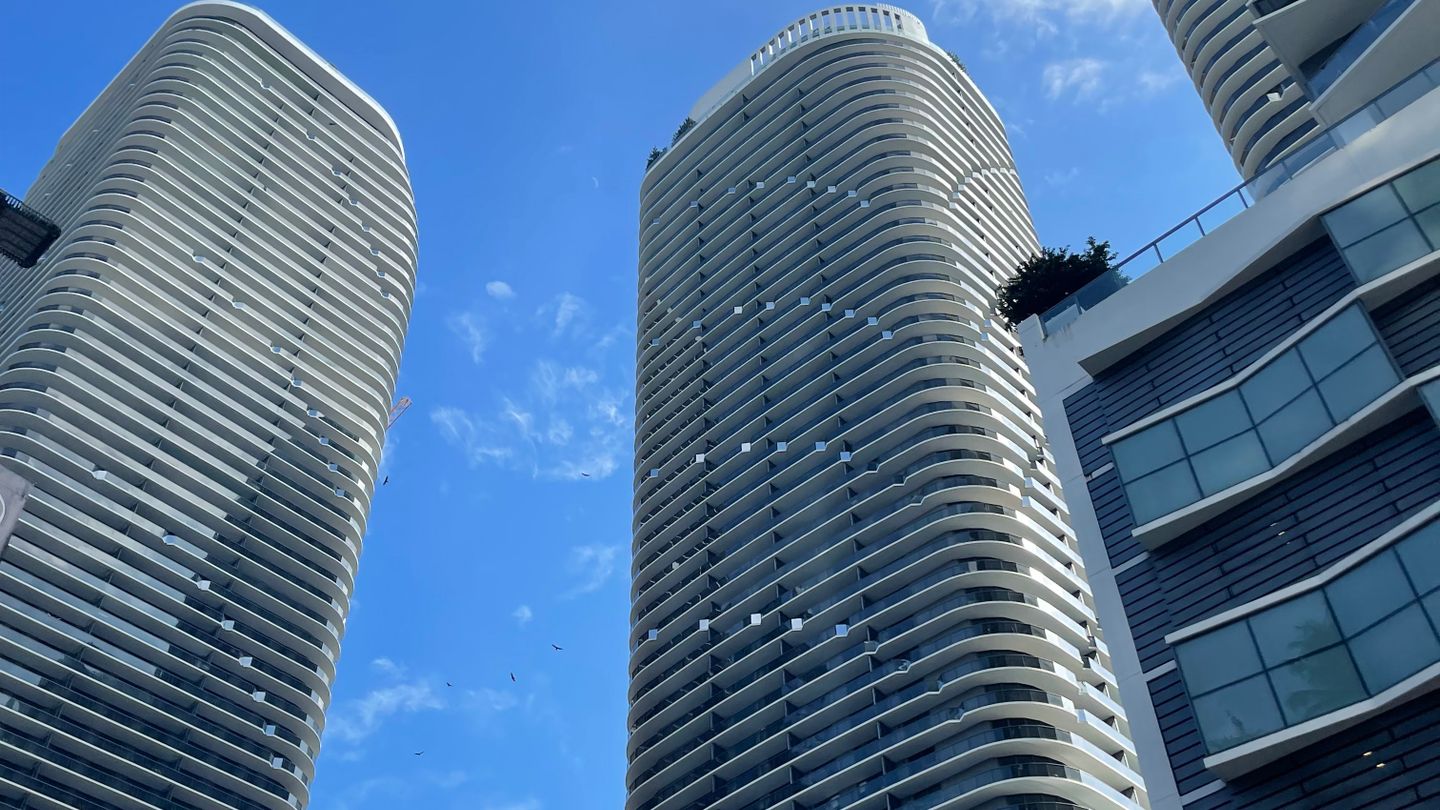
A house and a condominium in the same zip code face different supply physics. You cannot manufacture more waterfront lots in Coconut Grove or Miami Beach, so the house side of the market has a hard ceiling on inventory no matter what demand does. A condominium tower answers demand by stacking, and South Florida has spent a decade proving it. That alone explains a large part of the gap between 4.8 months and 12.
The second reason is that condos and houses are not competing for the same buyer any more. Cash accounted for 47.5 percent of Miami-Dade existing condo sales in July 2026 against 21.2 percent of single-family transactions, per MIAMI REALTORS + RWorld. The condo market is being carried by buyers who do not need a mortgage, which is a narrower pool than the financed house buyer, and a narrower pool absorbs listings more slowly.
The third reason is condition. A large share of Miami-Dade's condo inventory is older stock now carrying reserve funding and inspection obligations that a 2005 buyer never had to price. Those buildings sit longer and pull the county-wide condo figure up, while newer and well-funded associations trade closer to normal. That is why I read the 12 as an average of two very different populations, not as one market.
| Metric, July 2026 | Miami-Dade Condos | Miami-Dade Houses |
|---|---|---|
| Months of supply | 12.0 | 4.8 |
| Closed sales, year on year | +11.4% (921 to 1,026) | +5.6% (861 to 909) |
| Median sale price | $400,000 (-1.48%) | $685,000 (+3.79%) |
| Cash share of closings | 47.5% | 21.2% |
| Median days to contract | 86 | 45 |
| Percent of original list received | 93% | 96% |
| Dollar volume, year on year | -8.45% ($707M) | +16.53% ($1.3B) |
The row that surprises people is closed sales. Condo transactions rose faster than house transactions, 11.4 percent against 5.6 percent, and condo sales have now risen year over year in nine of the last eleven months. A 12-month supply figure alongside rising sales is not a market that nobody wants. It is a market where the listing pile is finally being worked through.

The Part Headlines Miss: Condo Supply Is Falling Fast
Almost every story written about Miami condos in 2026 stops at the 12. The more useful fact is what the 12 replaced. Miami-Dade condominium inventory fell for a sixth consecutive month in July 2026, the first run of six declines since July 2023, dropping 11.79 percent year over year from 12,838 active listings to 11,324, per MIAMI REALTORS + RWorld. In June the same series read 12.3 months. A market shedding listings six months in a row is not sitting still.
Total Miami-Dade active listings across all property types fell 15.1 percent year over year, from 18,377 to 15,599, the sixth straight monthly decline. Houses fell harder than condos: single-family inventory dropped 22.82 percent, from 5,539 listings to 4,275. Both sides of the market are tightening at once, which is why the house figure has already crossed into seller's-market territory and the condo figure is walking toward the 5.5-month balanced benchmark from above.
This is the piece I make sure a buyer understands before they write an offer. Months of supply is a snapshot, and a snapshot of a moving series tells you where you are, not where you are heading. If a client is planning to close in ninety days, the leverage they are pricing today is not necessarily the leverage they will have at contract.
| Inventory, July 2026 | Active Listings | One Year Earlier | Change |
|---|---|---|---|
| Miami-Dade, all types | 15,599 | 18,377 | -15.10% |
| Miami-Dade condominiums | 11,324 | 12,838 | -11.79% |
| Miami-Dade single-family | 4,275 | 5,539 | -22.82% |
| Broward, all types | 13,949 | 17,205 | -18.90% |
| Palm Beach, all types | 10,443 | 13,235 | -21.10% |
Three things are worth holding on to from this table. First, the declines are regional, not a Miami-Dade quirk. Second, they are large: a fifth of Palm Beach County's listings are gone in twelve months. Third, MIAMI REALTORS notes that even after these declines the condo totals remain well below pre-pandemic levels, so the starting point was already thin by historical standards.
Broward and Palm Beach: Same Split, Different Depth
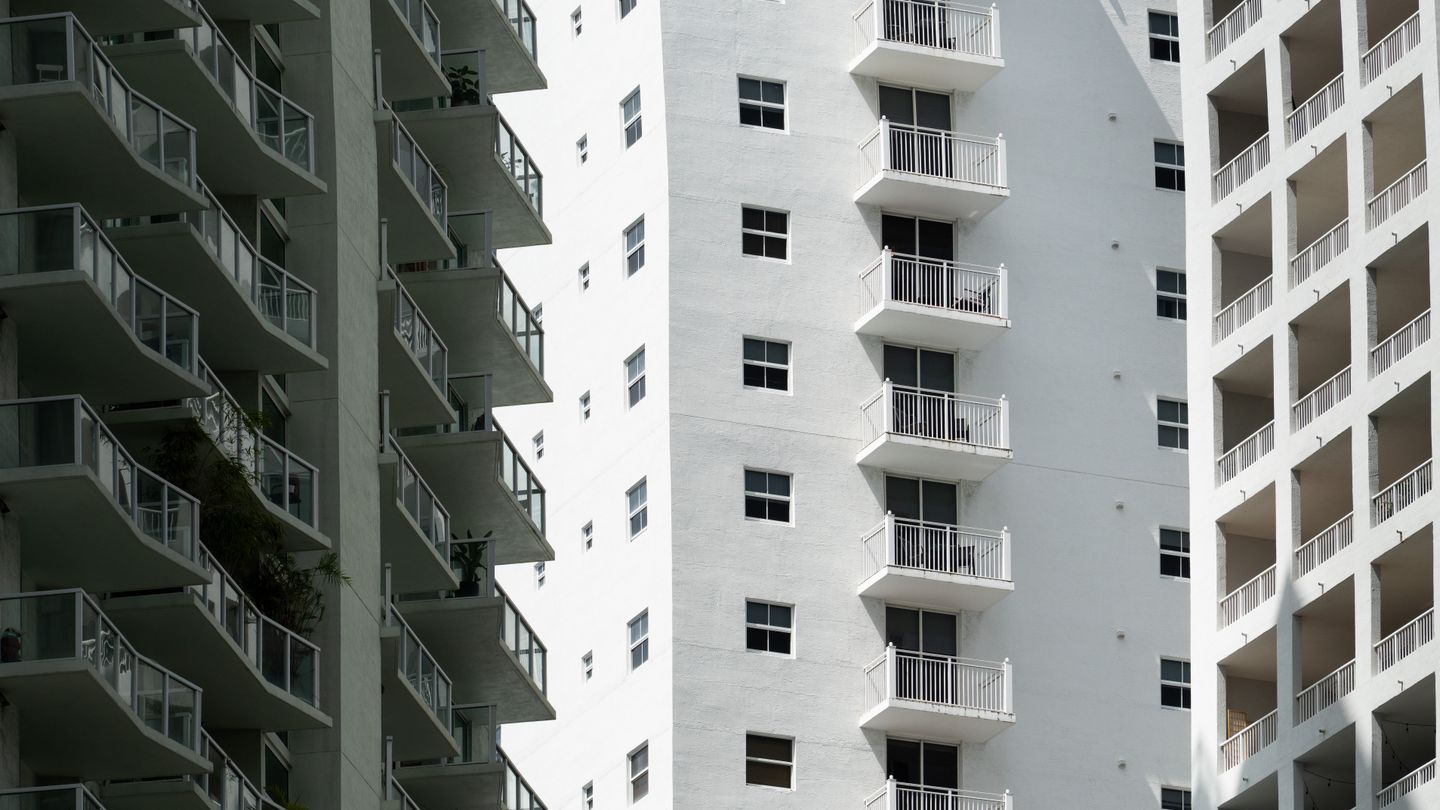
The condo-versus-house split repeats in all three counties, but the distance between the two sides narrows as you go north. Miami-Dade has the widest gap at 12 months against 4.8. Broward runs 10 against 4.3, per the Broward July 2026 release. Palm Beach runs 6.7 against 3.7, per the Palm Beach July 2026 release, which leaves its condominiums 1.2 months above the 5.5-month balanced benchmark rather than the 6.5 months above it that Miami-Dade carries.
Palm Beach is the outlier worth understanding. Its condo sales rose 18.55 percent year over year, its condo median price rose 3.99 percent to $312,500 while Miami-Dade's fell and Broward's fell harder, and 57.2 percent of its existing condo sales closed in cash. It is the only one of the three counties where the condo median is going up, and it is also the county with the highest cash share, which is not a coincidence.
Broward sits between the two and is the only county where condo sales fell, down 2.77 percent year over year even as its condo inventory dropped 15.79 percent. Fewer sales against much less inventory is what keeps its supply figure at 10 rather than pushing it lower. For a buyer comparing Fort Lauderdale to Miami on leverage alone, ten months against twelve is a real but modest difference.
| County, July 2026 | Condo Months | Condo Sales YoY | Condo Median Price | Condo Cash Share |
|---|---|---|---|---|
| Miami-Dade | 12.0 | +11.40% | $400,000 (-1.48%) | 47.5% |
| Broward | 10.0 | -2.77% | $255,000 (-3.77%) | 49.9% |
| Palm Beach | 6.7 | +18.55% | $312,500 (+3.99%) | 57.2% |
What 12 Months of Supply Costs You in Time
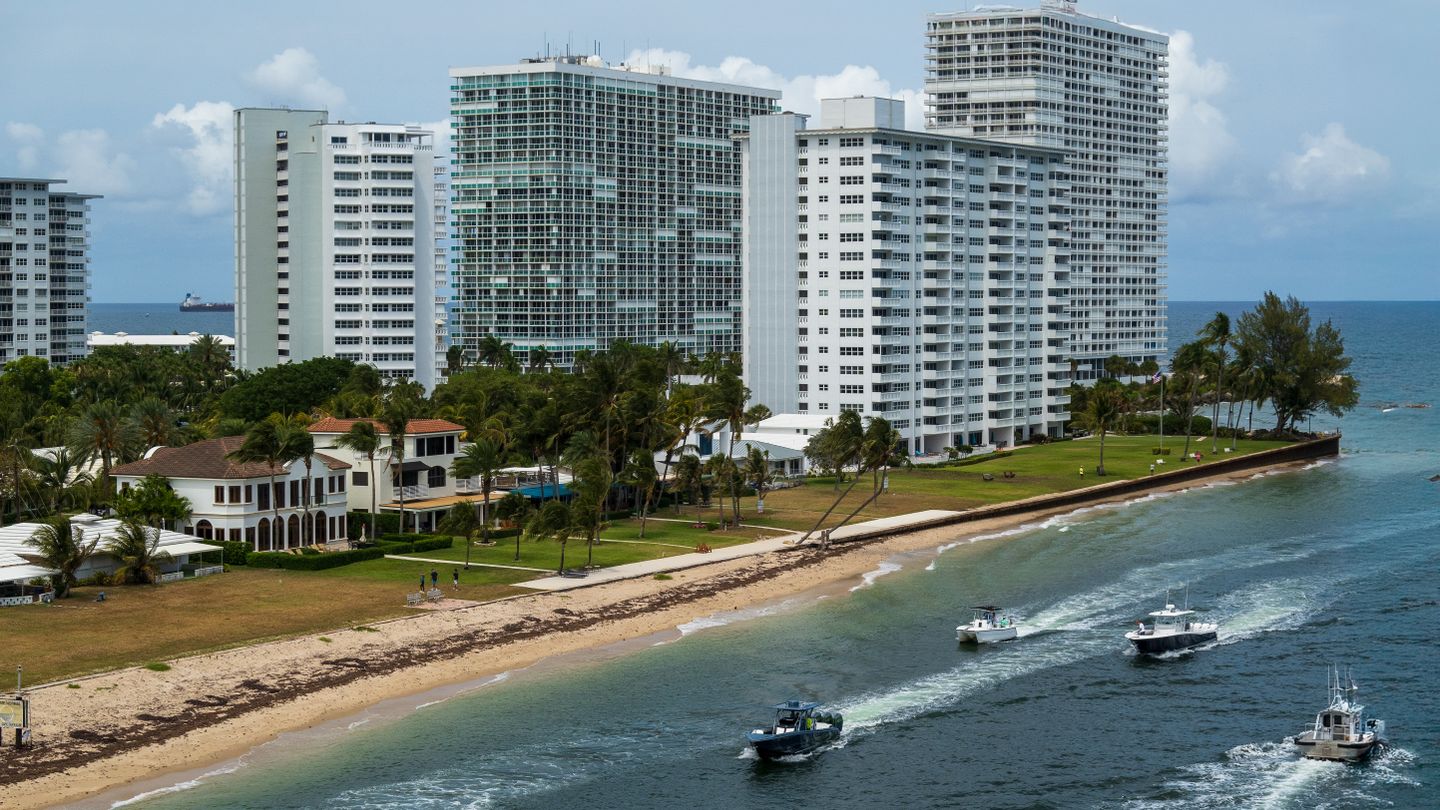
Months of supply is an abstraction until you convert it into calendar days, and the days are where a seller feels it. The median Miami-Dade condominium took 86 days to go under contract in July 2026 and 125 days to reach closing, against 65 and 107 days a year earlier. The median single-family home went under contract in 45 days and closed in 88. That is a 41-day gap at contract and a 37-day gap to close, in the same county, in the same month.
The price concession shows up in the same place. Miami-Dade condominiums received a median 93 percent of original list price while single-family homes received 96 percent. Three points does not sound like much until you apply it to a $900,000 asking price, where it is $27,000 of negotiating room that the house seller down the street simply does not have to give.
Here is the practical translation I give sellers. If you list a Miami condo today and the market behaves as it did in July, you should plan for roughly four months to a signed contract and about four months after that to funds, and you should expect to end up near 93 percent of where you started. If those numbers do not work for your timeline, the honest answer is to fix the price at listing rather than discover it in month five.
| Time to Sell, July 2026 | Days to Contract | Days to Sale | Percent of Original List |
|---|---|---|---|
| Miami-Dade condominiums | 86 (was 65) | 125 (was 107) | 93% |
| Miami-Dade single-family | 45 (was 45) | 88 (was 85) | 96% |
| Broward condominiums | 86 (was 71) | 122 (was 108) | 92% |
| Broward single-family | 34 (was 43) | 74 (was 81) | 96% |
| Palm Beach condominiums | 69 (was 70) | 112 (was 110) | 92% |
| Palm Beach single-family | 41 (was 46) | 82 (was 90) | 95% |
- Condos take longer everywhere: 69 to 86 days to contract across the three counties, against 34 to 45 for houses
- Only Palm Beach condos held their pace: 69 days versus 70 a year earlier, while Miami-Dade added 21 days and Broward 15
- Houses are getting faster in two counties: Broward fell from 43 days to 34, Palm Beach from 46 to 41
- The concession gap is consistent: condos land at 92 to 93 percent of original list, houses at 95 to 96 percent
The Financing Squeeze Sitting Underneath the Condo Number
There is a reason Miami condos take 86 days and houses take 45, and it has less to do with taste than with who can get a loan. Of the 2,397 condominium buildings across Miami-Dade, Broward and Palm Beach counties, only 21 are approved for FHA loans, which is 0.9 percent of the stock, according to U.S. Department of Housing and Urban Development figures cited by MIAMI REALTORS + RWorld. An entry-level buyer with an FHA pre-approval is locked out of ninety-nine percent of South Florida condo buildings before they see a single listing.
The conventional route tightened too. Fannie Mae and Freddie Mac eliminated the limited review option for many condominium loans on August 3, 2026, which means more buildings now face a full project review covering reserves, litigation and deferred maintenance. MIAMI REALTORS frames the change as one that should produce a more transparent and financially secure lending environment over time. In the short run it adds friction to exactly the transactions that were already the slowest.
Put the financing picture next to the cash figures and the 12 months explains itself. Cash covered 47.5 percent of Miami-Dade condo closings, 49.9 percent in Broward and 57.2 percent in Palm Beach. Where financing is hardest, cash carries the market, and a cash-carried market clears more slowly because the pool of qualified buyers is smaller. Freddie Mac put the 30-year fixed rate at 6.54 percent in July 2026, so the financed buyer who does qualify is also paying for the privilege.
When a client tells me condos are cheap in Miami right now, my first question is whether their building can be financed at all. A great price in a building that only trades to cash buyers is not a discount, it is your exit problem three years early.
Gerardo Gonzalez, Licensed Real Estate Agent at Compass
Why Pre-Construction Is Not in These Numbers
This is the limit of the whole data set, and it is stated plainly in the source. MIAMI REALTORS + RWorld notes in each monthly release that the sales totals do not include South Florida new construction, pre-construction and condo conversion sales, because those transactions are largely not reported in the MLS. Months of supply is therefore a resale measurement. Every tower selling from a sales gallery today sits outside the 12.
That matters more here than it would elsewhere, because the excluded slice is not small and it does not behave like the resale market. International buyers accounted for 49 percent of new South Florida construction, pre-construction and condo conversion sales over the eighteen months ending July 2025, according to the MIAMI REALTORS New Construction Global Sales Report. A market where roughly half the buyers are foreign is not being priced by the same conditions that are producing a 12-month resale figure.
So the two questions a buyer usually merges are genuinely separate. Whether resale condos give you leverage right now is answered by the supply table above. Whether a specific new tower is priced correctly is answered by its own absorption, its deposit structure and its developer's delivery record, none of which appear in a county statistic. The delivery calendar and the deposit schedule report cover that side.
Gerardo's Read: Using Supply as a Buyer and as a Seller
A supply figure is only useful once it changes a decision. Below is how I actually apply these three numbers, and the honest limit on each. The instruction common to all of them is to use the county figure to set expectations, then price the individual building, because a well-funded association and a deferred-maintenance association in the same corridor are not in the same market.
If You Are Buying a Condo
Twelve months of supply is real leverage, and the 93 percent of original list figure tells you roughly where it lands. What it does not give you is time. Inventory has fallen six straight months, so the leverage you are pricing today is smaller than it was in February and probably smaller than it will be in six months. Use it, do not wait for it to improve, and put the savings toward a building whose reserves are funded. The milestone inspection guide is where I would start that check.
If You Are Buying a House
At 4.8 months in Miami-Dade, 4.3 in Broward and 3.7 in Palm Beach you have almost none of the leverage a condo buyer has, and the 96 percent of original list figure confirms it. Houses go under contract in 45 days here against 86 for condos. Treat the supply number as a warning that hesitation costs you the property, and do your financing and inspection preparation before you find the house rather than after.
If You Are Selling a Condo
The market is not refusing to buy your unit, it is refusing to buy it at last year's number. Condo sales rose 11.4 percent in Miami-Dade and 18.55 percent in Palm Beach, so transactions are happening. Price to the first three weeks. In a 12-month market, a listing that misses its opening window joins a very long queue, and the discount you avoid at listing you pay back with interest at day 120. The South Florida market data report tracks the wider series month to month.
Months of supply is the only market number I quote to a client before I have seen the building, and I always quote its direction with it. Twelve and falling is a different instruction from twelve and rising, and most of the advice people are acting on this year is built on the level alone.
Gerardo Gonzalez, Licensed Real Estate Agent at Compass
How Months of Supply Is Calculated, and Why the Denominator Changes the Answer
Months of supply has no single agreed formula, and that is the part almost nobody states. The Florida Realtors market research glossary, updated August 5, 2026, says it outright: there is no single accepted way of calculating it. A common method divides current inventory by the most recent month's closed sales. Florida Realtors rejects that denominator because one month is a poor predictor of the next, and divides by the 12-month average of monthly closed sales instead, which strips out seasonality.
So the formula behind every county figure in the table above is active listings at month end, divided by the average monthly closed sales of the trailing twelve months. Data as of July 2026 throughout this report, the county figures MIAMI REALTORS published on August 17, 2026. These are the four definitions that formula rests on, quoted from the same glossary.
| Term | Published definition |
|---|---|
| Inventory (active listings) | The number of property listings active at the end of the month, counted on the last day. |
| Closed sales | The number of sales transactions that closed during the month. |
| Months supply of inventory | An estimate of the number of months it will take to deplete the current inventory given recent sales rates. |
| New pending sales | The number of listed properties that went under contract during the month. |
The MIAMI REALTORS county releases publish the supply figure without restating the formula, so the reconciliation that follows is my arithmetic on their own two published numbers, not theirs. Miami-Dade held 11,324 active condominium listings against 12.0 months of supply, which implies a denominator of about 944 closings a month. July's actual condo closings were 1,026. Run the single-month method on those same two figures and you get 11.0 months, a full month lower. The houses behave the same way: 4,275 listings against 4.8 months implies about 891 a month, July closed 909, and the single-month method returns 4.7.
Both implied denominators sit below the July count, which is exactly what a trailing average does in a market where sales are rising, and Miami-Dade condo closings were up 11.4 percent year over year. That is the consistency check, and it is why I read the published 12.0 as the conservative number rather than the alarming one.
Two limits on the definitions themselves. The glossary defines inventory as the count of listings active on the last day of the month, but it does not say whether a listing already under contract still counts as active, so the boundary between inventory and new pending sales is not published and I am not going to guess at it. And the balanced benchmark Florida Realtors publishes is 5.5 months, not the six-to-nine-month band that circulates in local coverage: above 5.5 is traditionally a buyer's market and below it a seller's market. On that benchmark five of the six South Florida markets in the table are unambiguous, and Palm Beach condominiums at 6.7 are the one sitting closest to the line.
Methodology and Sources
Every months-of-supply, inventory, sales, price, days-on-market and cash-share figure for the three counties comes from the July 2026 statistical releases published by MIAMI REALTORS + RWorld on August 17, 2026, drawn from the MIAMI MLS and BeachesMLS. The national supply and inventory figures are National Association of Realtors existing-home data for the same month. The mortgage rate is the Freddie Mac 30-year fixed average for July 2026. Statewide sales and price figures are Florida Realtors research data.
Three limits are worth stating plainly. First, months of supply is a resale measure: the source excludes new construction, pre-construction and condo conversion sales because they are largely not reported in the MLS. Second, these are county-level figures, so a single building or submarket can sit far from its county number, and the condo figure in particular averages a very wide range of building ages and reserve positions. Third, MIAMI REALTORS notes that its statistics may vary depending on reporting dates.
The formula, the four term definitions and the 5.5-month balanced benchmark come from the Florida Realtors market research glossary as it read on August 5, 2026, its own last-updated date. Where a figure is arithmetic of mine on two published numbers rather than a published number itself, the section above says so on the line.
Last verified September 30, 2026, when the formula, definitions and benchmark were re-confirmed against the glossary; the July 2026 county figures are unchanged since August 26, 2026. This page is refreshed when MIAMI REALTORS publishes a new monthly release that moves the supply figures materially, and the figures above are restated rather than adjusted.
Related Resources
- Miami Condo Market Q3 2026: Sales, Supply & Prices
- LuxuryDade's Census permit series for the Miami metro
- the 24,130 pipeline units these supply figures exclude
- Miami Price Per Square Foot 2026: 11 Areas Ranked
- who moved to South Florida, and how much income moved with them
- Miami Luxury Condo Market Mid-2026
- The $5M-plus Miami ultra-luxury condo market
- What a Miami condo actually costs to hold each year
- Brickell Luxury Condos Neighborhood Guide
- Miami Condo HOA Fees 2026: Averages by Type
- How buying pre-construction in Miami actually works
- LuxuryDade’s 2026 millage ranking for all 34 Miami-Dade municipalities
June 2026: Five Straight Months of Falling Condo Inventory
Miami-Dade condo inventory fell 11.47 percent year over year in June 2026, from 13,046 to 11,550 listings, the fifth straight monthly decline and the first such streak since July 2023, according to MIAMI REALTORS. What I tell buyers is that supply turns before price does, and the median condo price is still down 3.15 percent. That gap is the negotiating window, and it closes as months of supply keeps falling.
Frequently Asked Questions