LuxuryDade tracks Miami-Dade's quarter-close data, and September 2026 closed the third quarter with condominium sales up 1 percent year over year to 909 while the county condo median slipped 0.69 percent to $417,090, per MIAMI REALTORS + RWorld. What I am seeing from my Brickell desk is a repricing rather than a retreat, because condo inventory has now fallen for eight consecutive months. My advice for the fourth quarter is to underwrite the association before the view.
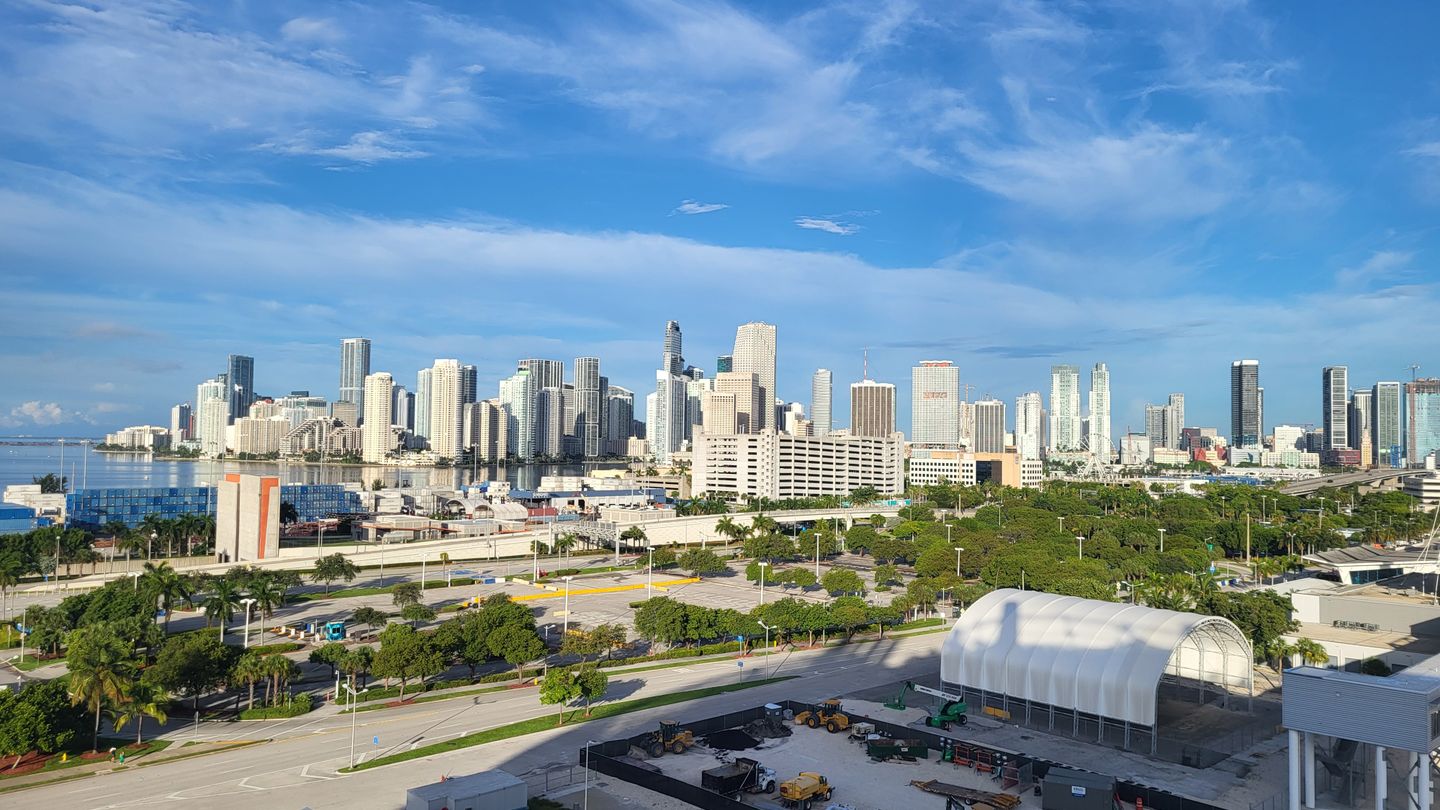
The third quarter of 2026 produced two Miami-Dade markets that barely acknowledge each other. At the top, the county broke its annual record for $30 million-plus home sales in nine months, logging 24 against a full-year 2025 record of 21, according to the September 2026 statistics MIAMI REALTORS + RWorld released on October 16, 2026. In the middle, total home sales fell 2 percent year over year and the single-family count dropped 4.7 percent.
Condominiums landed between those two stories. Sales edged up 1 percent to 909, the median slipped 0.69 percent to $417,090, and inventory fell for an eighth straight month. That combination, flat pricing on falling supply against a 7.46 percent mortgage rate, is the shape of the quarter. This report lays out every figure behind it, says plainly what the data does not cover, and ends with how I am reading it for buyers and sellers heading into the fourth quarter.
One scope note before the numbers, because it changes how every figure below should be read. MIAMI REALTORS + RWorld states that its sales totals exclude South Florida new construction, pre-construction and condo conversion sales, because those are largely not reported in the MLS. Everything in this report is resale data. The pre-construction pipeline is a separate market with separate economics, and we track it on the development watch hub.
- The Q3 2026 Table: Miami-Dade at the Quarter Close
- The Record That Ran Against the Market
- Sales: Condos Held While Houses Fell 4.7 Percent
- Prices: A Flat Condo Median and a 4 Percent House Median
- Supply: An Eighth Straight Month of Falling Condo Inventory
- The 7.46 Percent Rate and the Cash Share Underneath It
- Financing: 21 of 2,397 Condo Buildings Are FHA-Approved
- What This Data Does Not Cover
- Gerardo's Read: Using the Q3 2026 Numbers
- Methodology and Sources
- Frequently Asked Questions
The Q3 2026 Table: Miami-Dade at the Quarter Close
September is the quarter-close month, so its statistics are the cleanest single read on how the third quarter of 2026 ended. Everything in this table comes from the September 2026 Miami-Dade release MIAMI REALTORS + RWorld published on October 16, 2026, with the year-over-year change beside each figure, because a level without its direction is half a fact.
Read the two columns against each other rather than down. Condominiums and single-family homes in the same county, in the same month, are moving in opposite directions on almost every line.
| Metric, September 2026 | Existing Condominiums | Single-Family Homes |
|---|---|---|
| Closed sales | 909 (+1.0%) | 824 (-4.7%) |
| Median sale price | $417,090 (-0.69%) | $692,000 (+4.06%) |
| Dollar volume | $724 million (+7.13%) | $1.2 billion (+21.31%) |
| Active listings | 11,706 (-7.24%) | 4,536 (-16.6%) |
| Months of supply | 12.3 (buyer's market) | 5.1 (seller's market) |
| Cash share of closings | 49.4% | 26.2% |
| Median days to contract | 67 | 41 |
| Median days to sale | 102 | 80 |
| Percent of original list received | 94% | 95% |
We are continuing to see the negative impact of soaring mortgage rates on homebuyers, but upper-end buyers have remained active, with this trend likely to continue through next year as mortgage rates remain elevated.
Gay Cororaton, Chief Economist, MIAMI REALTORS + RWorld, September 2026 statistics release
The Record That Ran Against the Market
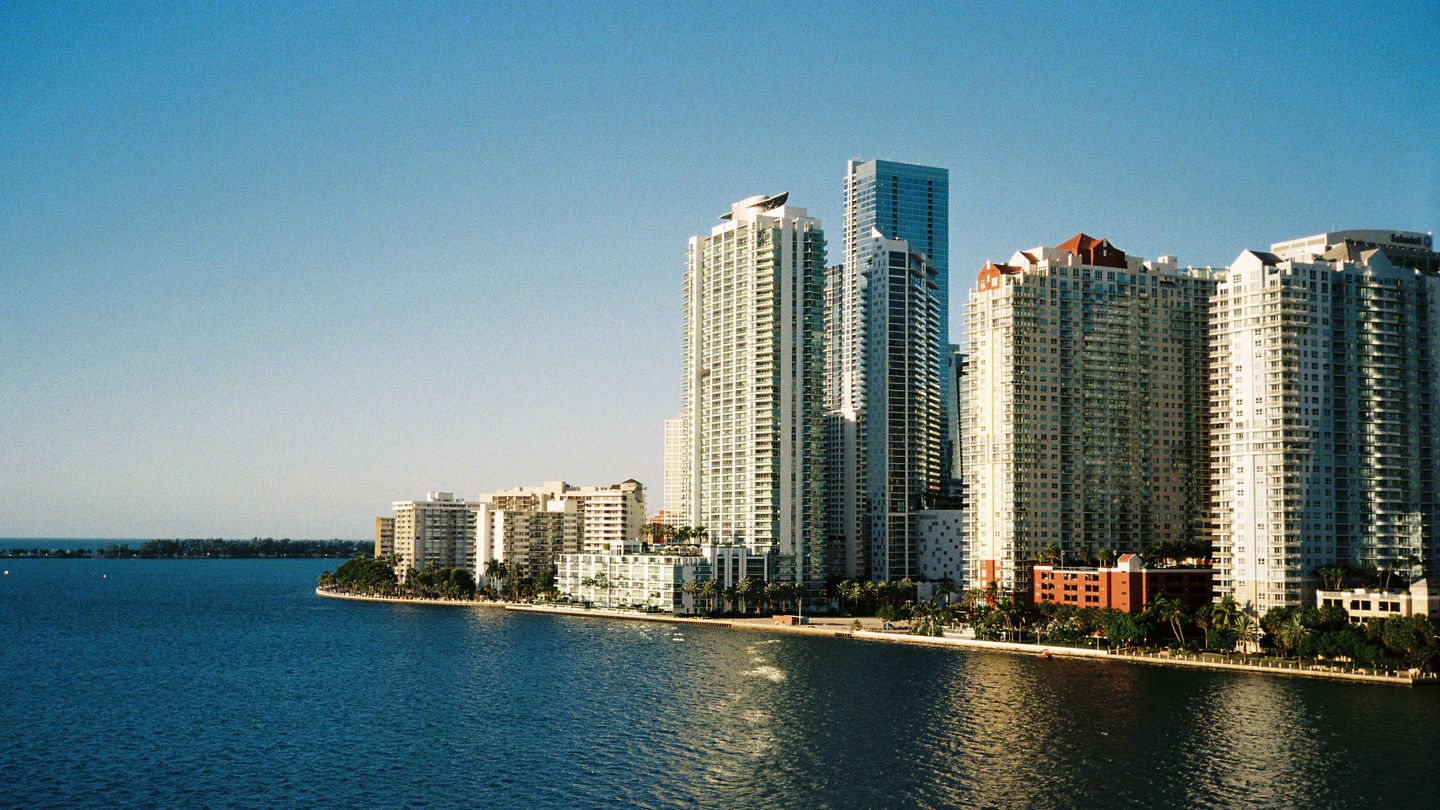
The headline fact of the quarter is a record set from the top down. Through September 2026, Miami-Dade recorded 24 single-family and condominium sales of $30 million or more, beating its full-year 2025 record of 21 transactions by 14.3 percent with a quarter still to run. At that pace MIAMI REALTORS + RWorld projects 32 such sales by year end.
That record sits directly against a middle market that contracted. Total home sales fell 2 percent year over year in September, from 1,769 to 1,733, and the county's eleven-month streak of rising year-over-year sales had already ended in August. The two facts are not in conflict, they describe different buyers: one group is rate-sensitive and the other is not.
The association's own framing is worth quoting precisely, because it is the part that gets lost when the $30 million number travels alone. Chairman of the Board Alfredo Pujol paired it with the observation that condo sales near the $400,000 median price point rose 15 percent year over year, which he offered as evidence of activity beyond the luxury tier rather than instead of it.
For context on where Miami's prices actually sit globally, the 2026 Knight Frank Wealth Report found that $1 million buys 58 square metres of prime property in Miami, against 16 in Monaco, 34 in New York, 33 in London and 37 in both Paris and Tokyo. Our ultra-luxury market report covers the $5 million-plus tier in depth.
Sales: Condos Held While Houses Fell 4.7 Percent
Condominiums were the steadier half of the quarter. Sales rose 1 percent year over year in September 2026, from 904 to 909, while single-family transactions fell 4.7 percent, from 865 to 824. The strongest band was not the luxury tier at all: condos priced from $300,000 to $400,000 posted 14.5 percent sales growth, rising from 159 closings to 182.
MIAMI REALTORS + RWorld attributes the broader decline to three things it names directly: mortgage rates rising nearly 0.6 percentage points since early September, limited inventory in certain price ranges, and uncertainty around Florida's October 6 state of emergency ahead of Hurricane Isaias. South Florida was not among the 29 affected counties, but hurricane threats delay mortgage approvals, loan funding and closings regardless.
Dollar volume tells a different story from transaction counts, and it is the one I watch. Total county dollar volume rose 15.41 percent year over year to $1.8 billion even as the number of sales fell, with single-family volume up 21.31 percent to $1.2 billion and condo volume up 7.13 percent to $724 million. Fewer sales, more money: the mix moved upmarket.
Prices: A Flat Condo Median and a 4 Percent House Median
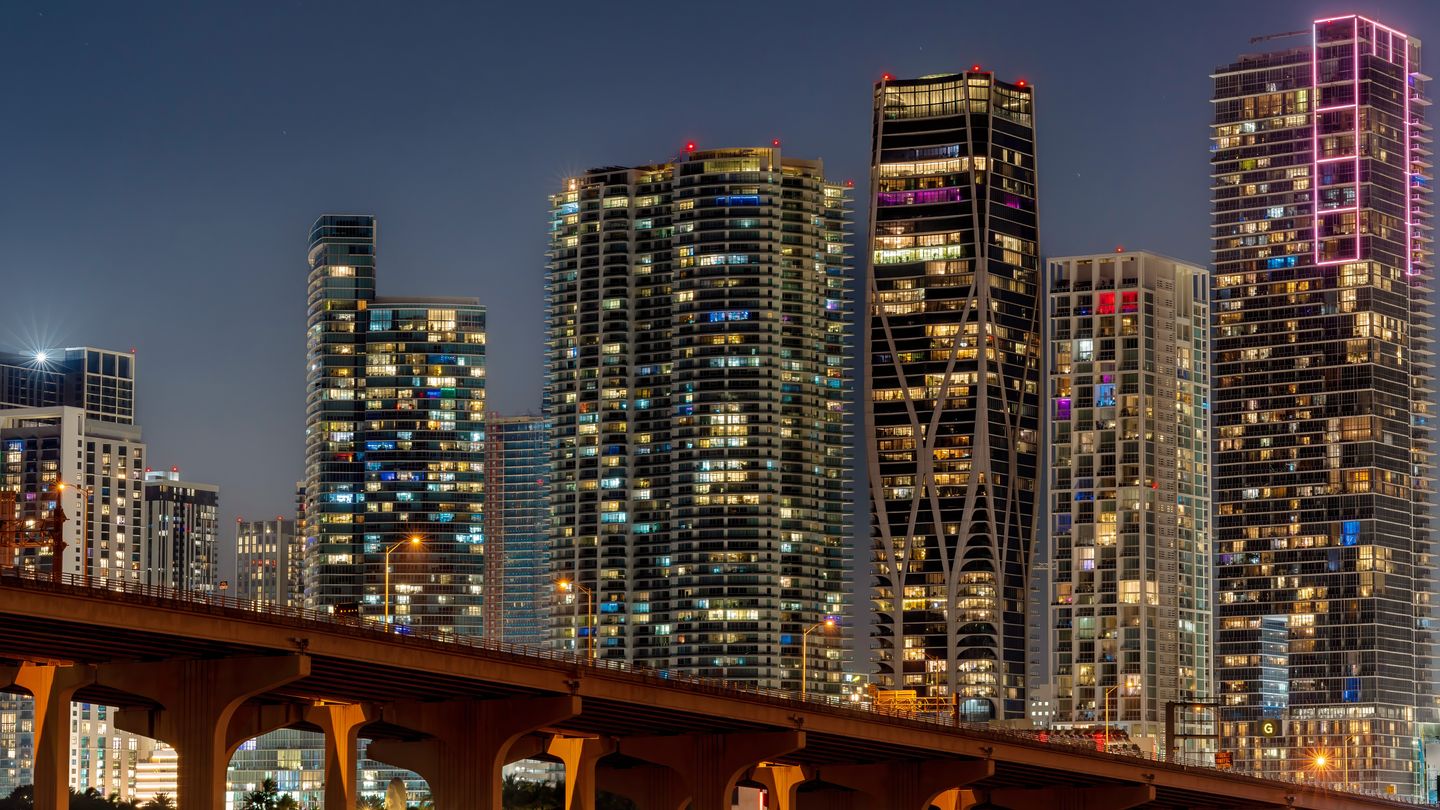
The condominium median sale price in Miami-Dade was $417,090 in September 2026, down 0.69 percent from $420,000 a year earlier. Calling that a decline overstates it. A 0.69 percent move across twelve months is price stability with a rounding error attached, and it sits inside a long record: condo median prices have stayed even or increased in 166 of the last 184 months, which is more than fourteen years.
The single-family median went the other way, rising 4.06 percent year over year to $692,000 from $665,000. Those prices have risen in 175 of the last 179 months. Over the longer arc the two property types have both compounded hard: condo prices are up 267 percent since 2011, from $113,800, and single-family prices are up 300.7 percent, from $172,700.
The flat condo median is the number most likely to be misread, so it is worth being precise about what it measures. A median is the midpoint of what actually sold, not a valuation of what exists. In a quarter where inventory fell for an eighth month and the $300,000 to $400,000 band grew 14.5 percent, a flat median is partly a mix effect: more closings at the lower end pull the midpoint down even where individual units held value.
| Median Sale Price | September 2026 | September 2025 | Change | Since 2011 |
|---|---|---|---|---|
| Miami-Dade existing condominiums | $417,090 | $420,000 | -0.69% | +267% |
| Miami-Dade single-family homes | $692,000 | $665,000 | +4.06% | +300.7% |
| Florida condo-townhouse | $293,500 | n/a | -1.8% | n/a |
| Florida single-family | $415,000 | n/a | +1.2% | n/a |
| United States, all existing homes | $417,500 | $412,300 | +1.3% | n/a |
The statewide and national rows come from Florida Realtors and the National Association of Realtors respectively. The national median has now risen year over year for 39 consecutive months. Miami's condo median is the one line in that table going the other way, and the gap is under two percentage points.
Supply: An Eighth Straight Month of Falling Condo Inventory
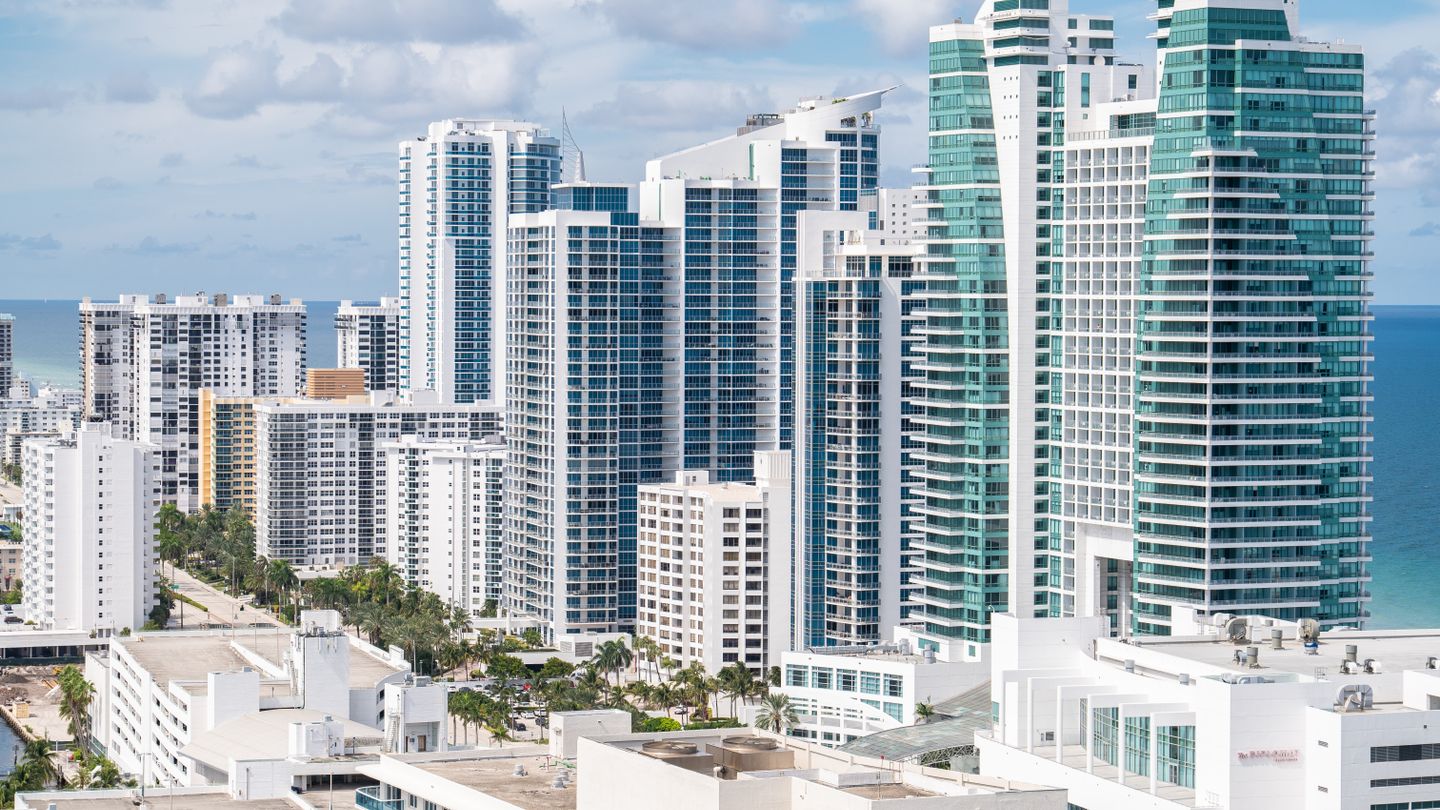
This is the number that reframes everything above it. Miami-Dade condominium inventory declined for an eighth consecutive month in September 2026, falling 7.24 percent year over year from 12,620 active listings to 11,706. MIAMI REALTORS + RWorld notes that even after that run the condo total remains significantly below pre-pandemic levels, so the starting point was already thin by historical standards.
Total active listings across all property types fell 10.1 percent, from 18,057 to 16,242, the county's eighth straight monthly decline. Houses tightened harder than condos: single-family inventory dropped 16.6 percent, from 5,437 listings to 4,536. Both sides of the market are losing supply at once, which is the mechanism behind the association's own forecast that declining condo inventory will put upward pressure on prices.
Converted to months of supply, Miami-Dade single-family homes sat at 5.1 months in September 2026 and existing condominiums at 12.3. A balanced market offers between six and nine months, so the county holds a seller's market and a buyer's market simultaneously, split by property type. Our standing months of supply report tracks that split across all three South Florida counties.
| Inventory, September 2026 | Active Listings | One Year Earlier | Change |
|---|---|---|---|
| Miami-Dade, all property types | 16,242 | 18,057 | -10.1% |
| Miami-Dade condominiums | 11,706 | 12,620 | -7.24% |
| Miami-Dade single-family | 4,536 | 5,437 | -16.6% |
| United States, all existing homes | 1,600,000 | n/a | +4.6% |
The last row is the contrast that matters for anyone comparing Miami to the country. National inventory rose 4.6 percent year over year to 1.60 million units and national months of supply rose from 4.5 to 4.8, per NAR. Miami-Dade moved in the opposite direction on both counts. Whatever is happening to supply here is local, not a national trend arriving late.

The 7.46 Percent Rate and the Cash Share Underneath It
Mortgage rates rose nearly 0.6 percentage points between September 1 and October 13, 2026, reaching 7.46 percent. MIAMI REALTORS + RWorld names that move first among the reasons September sales fell, and attributes the elevated level to a combination of inflationary pressure, federal debt and competition for investor capital.
Cash is what keeps the top of this market moving while the financed middle slows. Cash accounted for 38.3 percent of all Miami closed sales in September 2026, against roughly 27 percent of US home sales per NAR. Split by property type the gap widens sharply: 49.4 percent of existing condo sales closed all cash, against 26.2 percent of single-family transactions.
That split is the clearest single explanation for why condo transactions held at plus 1 percent while houses fell 4.7 percent in a month when rates jumped. Roughly half the condo market never consulted a rate sheet. The house market, where three quarters of buyers finance, felt the full move.
| Speed and Terms, September 2026 | Existing Condominiums | Single-Family Homes |
|---|---|---|
| Median days to contract | 67 (was 75) | 41 (was 50) |
| Median days to sale | 102 (was 115) | 80 (was 89) |
| Percent of original list received | 94% | 95% |
| Cash share of closings | 49.4% | 26.2% |
The direction of the first two rows is the quiet good news of the quarter, and it runs against the mood of the headline. Condos went to contract nine days faster than a year earlier and closed thirteen days faster. Houses improved by nine days on both measures. A market shedding inventory for eight months is also transacting faster, which is not the fingerprint of a market in trouble.
- Distressed sales stayed at historic lows: 0.5 percent of all closed Miami residential sales, split 0.2 percent REO and 0.2 percent short sales, against 70 percent in 2009
- Sellers are holding near ask: condos received 94 percent of original list price, houses 95 percent
- Economic impact: 1,733 Miami-Dade sales at the NAR figure of $129,000 per typical Florida home sale equals $223 million in local economic impact
Financing: 21 of 2,397 Condo Buildings Are FHA-Approved
The structural constraint under the condo figures has nothing to do with demand. Of the 2,397 condominium buildings across Miami-Dade, Broward and Palm Beach counties, only 21 are approved for FHA loans, which is 0.9 percent of the stock, according to U.S. Department of Housing and Urban Development figures cited by MIAMI REALTORS + RWorld. An entry-level buyer holding an FHA pre-approval is excluded from roughly ninety-nine percent of South Florida condo buildings before they open a single listing.
The conventional route tightened inside the quarter. Fannie Mae and Freddie Mac eliminated the limited review option for many condominium loans on August 3, 2026, so more buildings now face a full project review covering reserves, litigation and deferred maintenance. The association frames that change as one that should produce a more transparent and financially secure lending environment over time, and calls the lack of FHA-eligible buildings a brake on further market strengthening.
Read that next to the 49.4 percent cash share and the condo market explains itself. Where financing is hardest, cash carries the market, and a cash-carried market is a narrower market. It is also why the gap between a well-funded association and an underfunded one now shows up in price rather than in days on market: one is financeable and the other is not. The building financial health guide covers how to check before you offer.
When a client tells me Miami condos look cheap right now, my first question is whether their building can be financed at all. A good price in a building that only trades to cash buyers is not a discount, it is your exit problem three years early.
Gerardo Gonzalez, Licensed Real Estate Agent at Compass
What This Data Does Not Cover
Every figure above has a boundary, and it is stated plainly in the source rather than inferred. MIAMI REALTORS + RWorld notes in each monthly release that its sales totals do not include South Florida new construction, pre-construction and condo conversion sales, because those transactions are largely not reported in the MLS. This is a resale report. Every tower selling from a sales gallery today sits outside every number on this page.
That boundary matters more here than it would in most metros, because the excluded slice is large and does not behave like the resale market. International buyers accounted for 49 percent of new South Florida construction, pre-construction and condo conversion sales over the eighteen months ending July 2025, according to the association's New Construction Global Sales Report. A segment where roughly half the buyers are foreign is not priced by the same forces producing a 12.3-month resale supply figure.
So two questions buyers routinely merge are genuinely separate. Whether resale condos give you leverage this quarter is answered by the tables above. Whether a specific new tower is priced correctly is answered by its own absorption, deposit structure and the developer's delivery record, none of which appear in a county statistic. The delivery calendar and the deposit schedule report cover that side.
Two further limits are worth naming. These are Miami-Dade figures only, so Broward and Palm Beach conditions differ and are tracked separately. And September is one month used as a quarter-close proxy: it is the cleanest available read on where Q3 2026 ended, but it is not the sum of July, August and September.
Gerardo's Read: Using the Q3 2026 Numbers
My read on this quarter is that the condo median being down 0.69 percent while inventory falls for an eighth month is not a soft market, it is a repricing. The units clearing now are the ones whose associations have funded reserves. The ones sitting are the ones that have not. When a buyer asks me why two apparently identical lines in the same building are tens of thousands of dollars apart, that is almost always the answer, and no county-level statistic will show it to you.
If You Are Buying a Condo
12.3 months of supply is real leverage, and the 94 percent of original list figure tells you roughly where it lands. What it does not give you is time. Inventory has fallen eight straight months and days to contract improved by nine days, so the leverage you are pricing today is smaller than it was in February. Use it now rather than waiting for it to improve, and spend the savings on a building whose reserves are funded. The milestone inspection guide is where I start that check.
If You Are Buying a House
At 5.1 months of supply, with the median house going under contract in 41 days and inventory down 16.6 percent in a year, you have almost none of the leverage a condo buyer has. The median single-family seller received 95 percent of original list. Treat the supply figure as a warning that hesitation costs you the property, and finish your financing and inspection preparation before you find the house rather than after.
If You Are Selling a Condo
The market is not refusing to buy your unit, it is refusing to buy it at a number that ignores the association's balance sheet. Condo sales rose, dollar volume rose 7.13 percent and the median held within a percentage point, so transactions are happening. Price to the first three weeks and have the reserve study, the milestone inspection status and the assessment history ready on day one. The seller guide covers the full preparation list.
If You Are Watching the Ultra-Luxury Tier
Twenty-four $30 million-plus sales in nine months against a full-year record of 21 tells you the top is operating on a different clock from the rest of the county. That tier is cash, it is global, and a 0.6 percentage point move in mortgage rates does not reach it. Do not use its record to set expectations for a $600,000 Brickell resale, and do not use the flat county median to set expectations for a waterfront trophy. They are two markets wearing one county's name.
The quarter-close number I would hand a client is not the median, it is the eight months of falling inventory next to it. Flat pricing on shrinking supply is the setup before a move, not the aftermath of one, and most of the advice people are acting on this year is built on the median alone.
Gerardo Gonzalez, Licensed Real Estate Agent at Compass
Methodology and Sources
Every Miami-Dade sales, price, dollar-volume, inventory, months-of-supply, days-on-market, cash-share and distressed-sale figure on this page comes from the September 2026 statistical release published by MIAMI REALTORS + RWorld on October 16, 2026, reported from the MIAMI MLS and BeachesMLS. September is used here as the quarter-close month for Q3 2026.
National existing-home sales, median price, inventory, months of supply, the cash-share comparison and the $129,000 economic-impact-per-sale figure are National Association of Realtors data for the same month. Statewide Florida sales and median prices are Florida Realtors research data. The FHA building-approval counts are U.S. Department of Housing and Urban Development figures as cited in the Miami Realtors release. The global price comparison is the 2026 Knight Frank Wealth Report. The 7.46 percent mortgage rate is the level reported in that release as of October 13, 2026.
Four limits are worth stating plainly rather than leaving for the reader to discover. First, this is resale data: the source excludes new construction, pre-construction and condo conversion sales because they are largely not reported in the MLS, so the entire pre-construction pipeline sits outside every figure here. Second, these are county-level numbers, and the condo figure in particular averages a very wide range of building ages and reserve positions, so a single building can sit far from its county statistic.
Third, September is a single month standing in for a quarter. It is the cleanest available read on where Q3 2026 ended and it is what the publisher released, but it is not the sum of July, August and September, and this page does not present it as one. Fourth, MIAMI REALTORS + RWorld notes that its statistics may vary depending on reporting dates, and states that it reports figures directly from its MLS system.
No figure on this page is an estimate, a projection or arithmetic of ours except where the text says so on the line. The one projection quoted, 32 $30 million-plus sales by year end, is the publisher's own, not ours.
Last verified October 21, 2026 against the October 16, 2026 release. This page is refreshed when MIAMI REALTORS + RWorld publishes the Q4 2026 quarter-close data, expected in January 2027, and figures are restated rather than adjusted.
Related Resources
- LuxuryDade's Census permit series for the Miami metro
- the 24,130 pipeline units these supply figures exclude
- Miami Price Per Square Foot 2026: 11 Areas Ranked
- who moved to South Florida, and how much income moved with them
- Miami Luxury Condo Market Mid-2026
- The $5M-plus Miami ultra-luxury condo market
- What a Miami condo actually costs to hold each year
- Brickell Luxury Condos Neighborhood Guide
- Miami Condo HOA Fees 2026: Averages by Type
- How buying pre-construction in Miami actually works
- LuxuryDade’s 2026 millage ranking for all 34 Miami-Dade municipalities
Frequently Asked Questions